Architecture
First, Let's take a look at the overall design we developed for the system!
When implementing, our designed system can be further divided into engineering solution and data science solution.

Engineering Solution
The software engineering solution is the very first part of our designed system! Basically, we built up a system that can generate
the distance score based on the image datasets we are given and the target algorithm we want to test with.
The score produced will then be used by the data science solution, which we will introduce later :)
System Components:
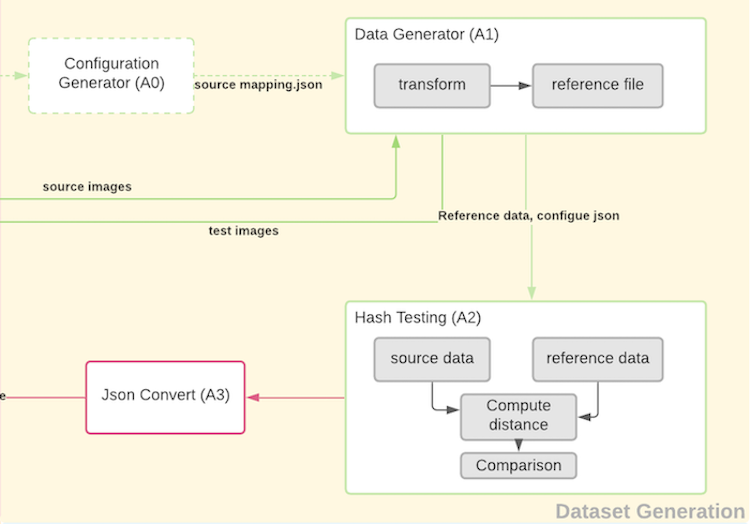
- Dataset Generator: This is where everything starts! The system takes in given images and transforms them to test images of different styles, such as rotate, adding border, etc.
- Hash Testing: The hash testing tool will then compare between the original images (base images) and the transformed images (test images), and generate results for the further analysis in the data science solution.
- Configuration Automation(Local): When we were analysing the first algorithm (Tech A), we first built up the system and tested it locally. To raise the efficiency, we developed configuration apps that can automate a lot of work in the system.
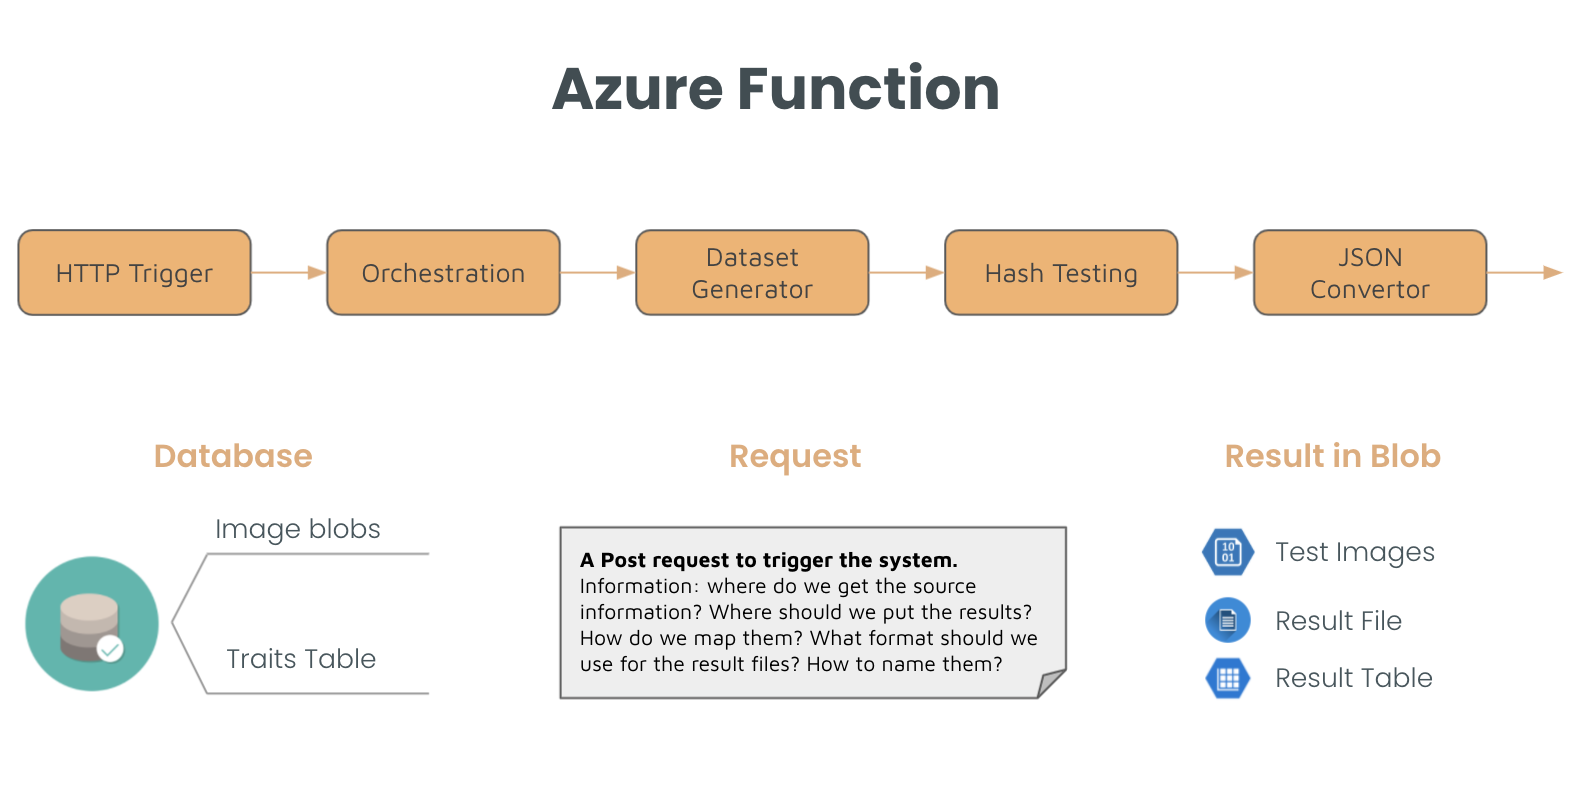
- Azure Function Pipeline(Cloud): We also built up Azure functions to implement the system on cloud to meet the sponsor’s needs. We send out a Post request to trigger the system; the system then takes the source information from the database, process the original data, and put the results in Azure blob.
Data Science Solution
Now that we have the results from the engineering solution, we can feed the results into the data analysis flow.
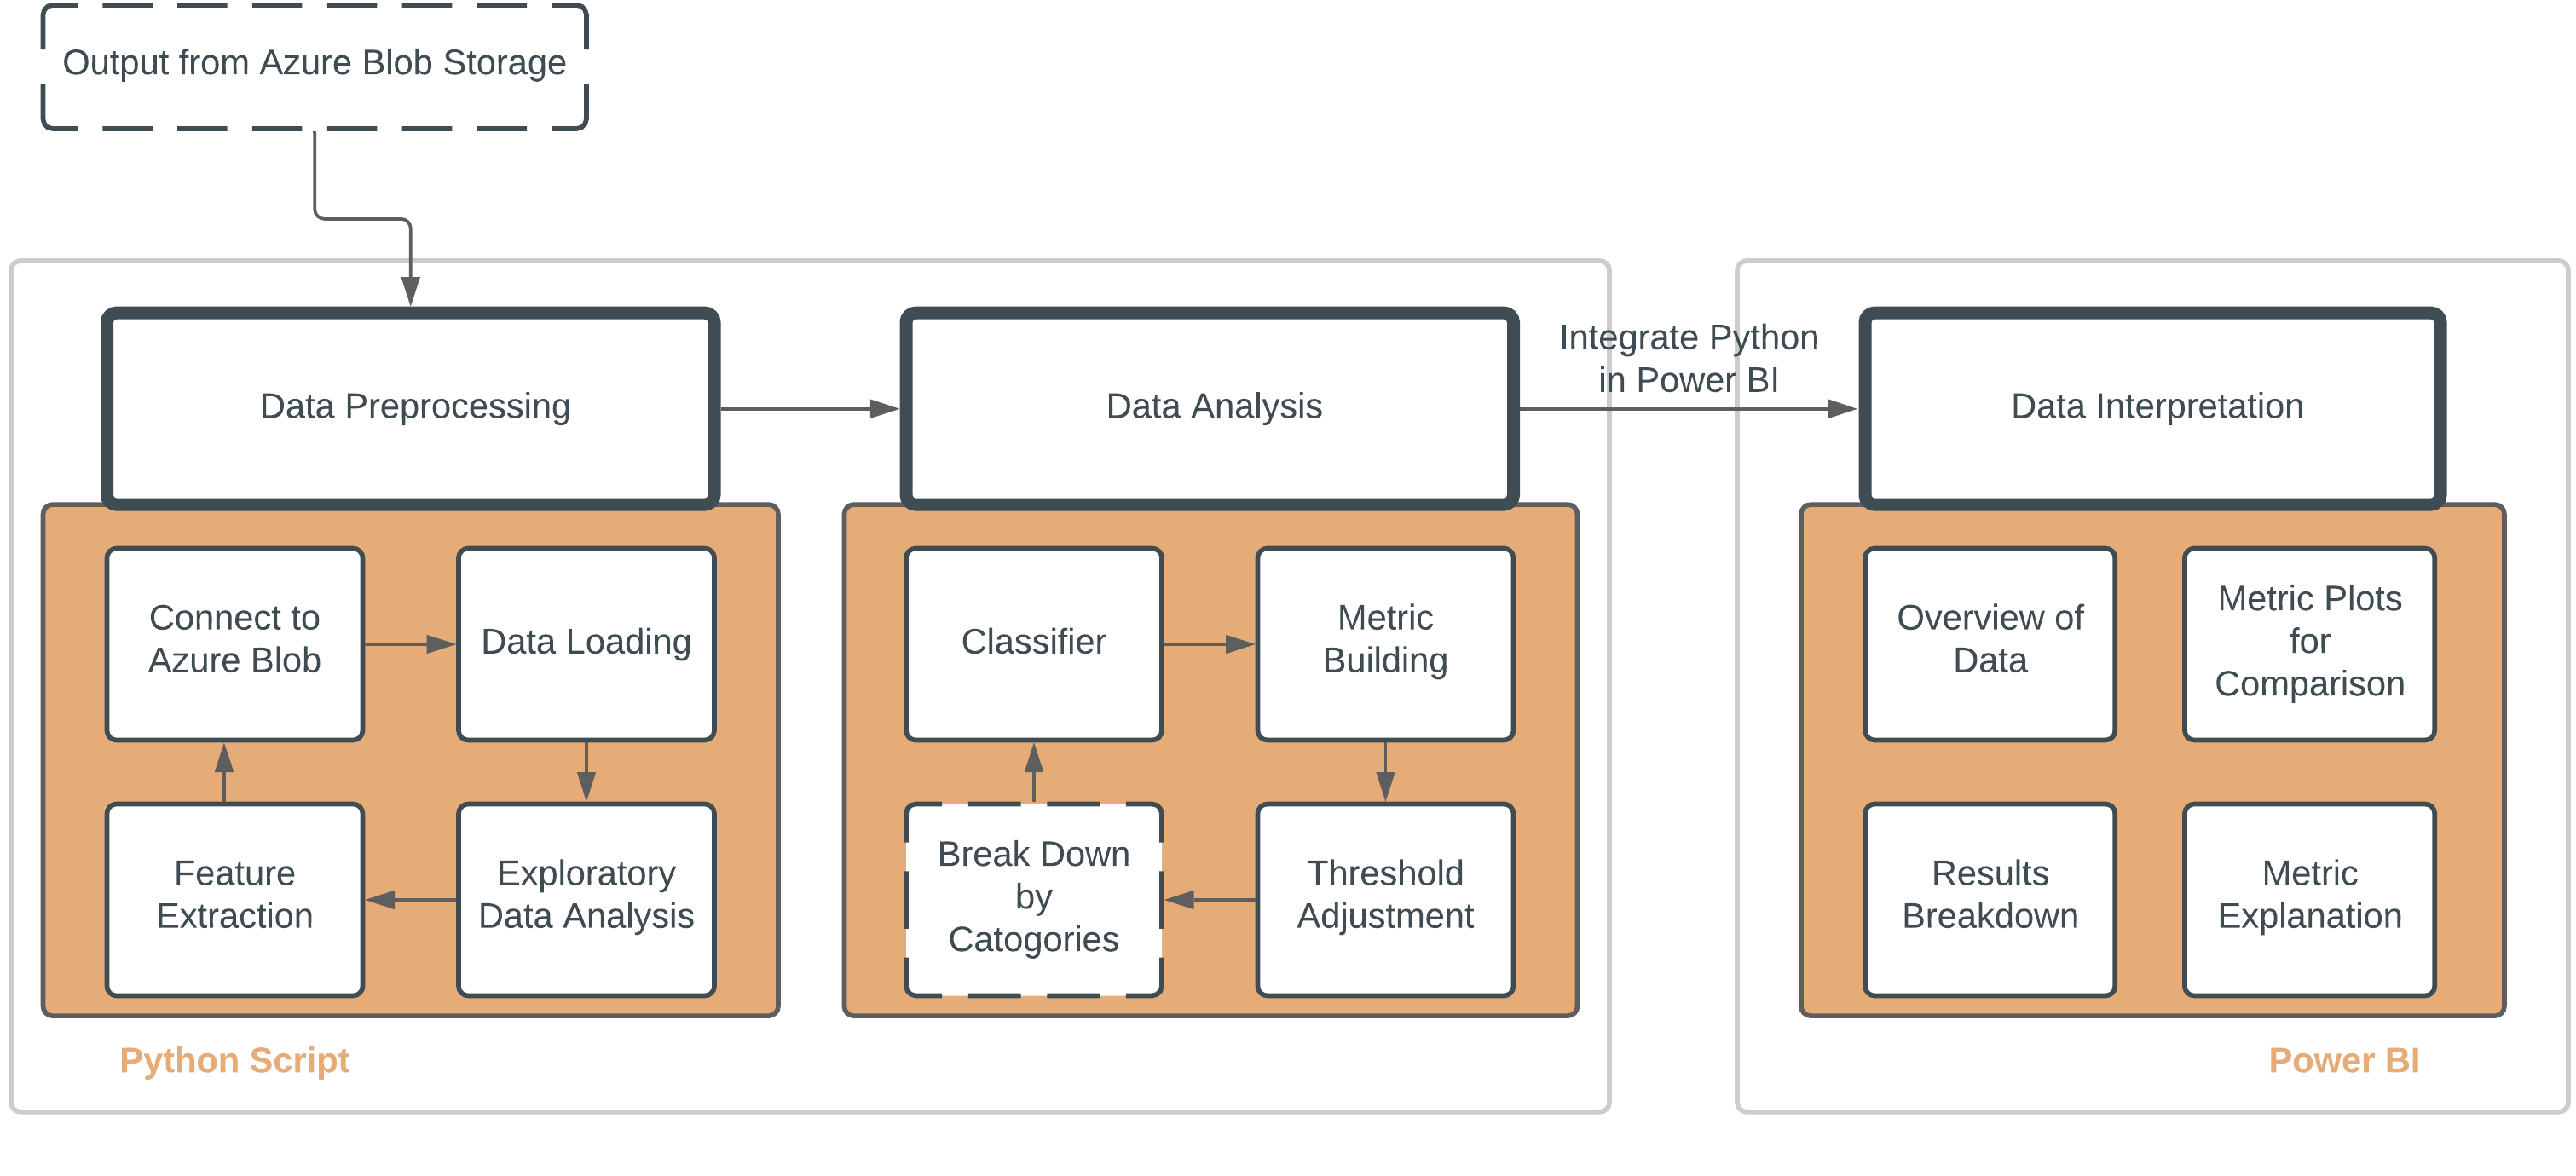
There are three parts in our data analysis flow. We used the python script to process data, integrated Python to Power BI and
then provide the informative dashboard to support the Xbox team’s decision making. More details are in the below flow chart.
Metrics Details:
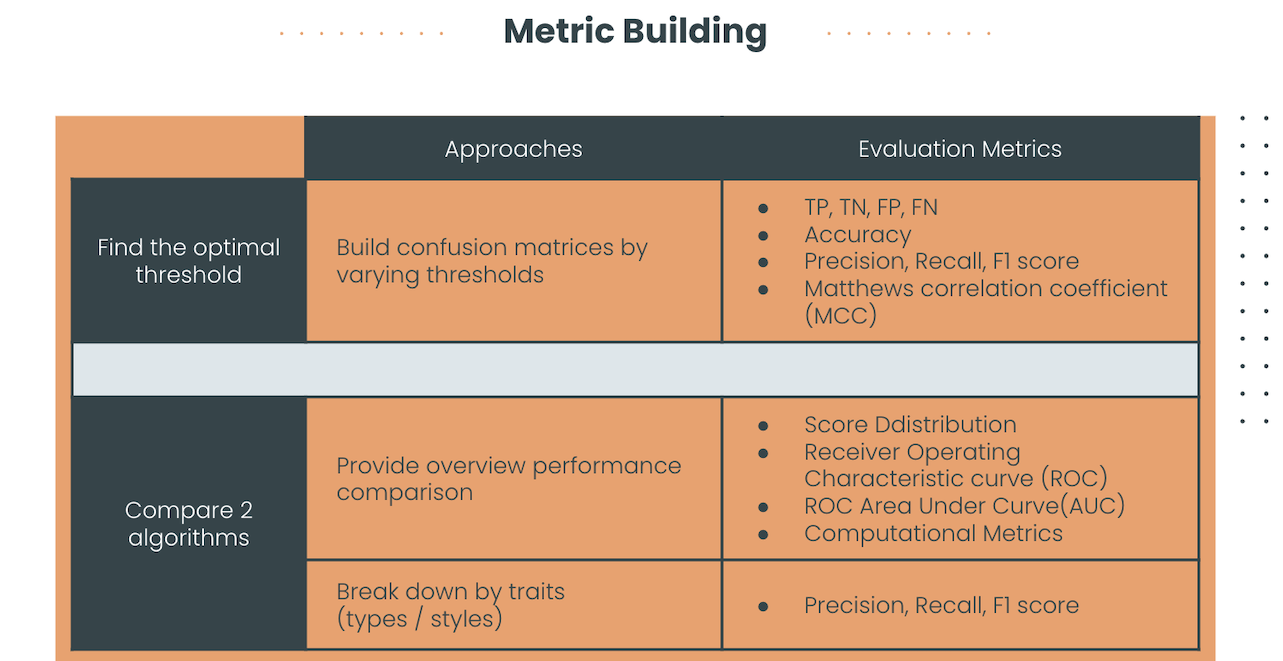
- Next, what kind of metrics did we use? Our goal is to find the optimal threshold for evaluation and then evaluate the performance of technologies by different styles of images, so we classified the output from our algorithm, and compared the performance in diverse thresholds.
- For the first goal, we built a confusion matrix in each threshold. The metrics we designed here include several threshold metrics, such as precision, recall and F1 score.
- For algorithm comparison, we tried to give the overview performance comparison, like the ROC curve and computational metrics. We also explored more details in each technology, so we used some slicers to see the differences of threshold metrics in diverse traits. For example, do the results from style A perform better than results from style B when we use technology A? Based on the results from these evaluation metrics, we provided the Power Bi dashboard and gave the Xbox team clear suggestions.


